On a project I decided to use Soap-UI to test REST services. Since I wanted to add some DBUnit datasets before executing the test, I decided to use it with jUnit as described here.
At the beginning everything worked well but as more tests were added, a GC Overhead appears and increasing the Heap Space and the Permgen did not resolved anything.
I will now tell you how this GC Overhead was resolved.
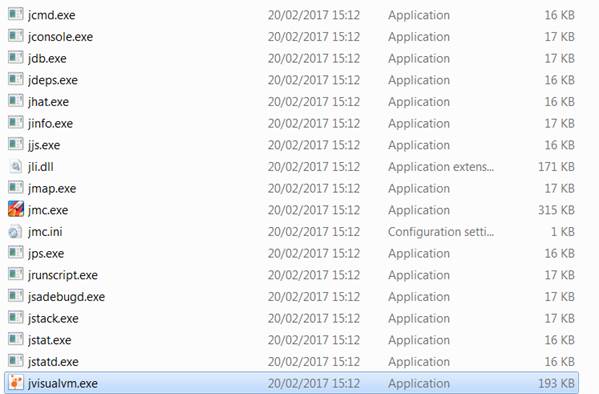
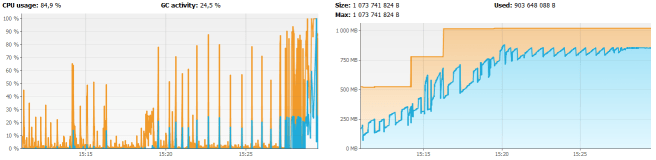
When a GC Overhead or any memory problem occurs the execution must be monitored with jvisualvm a tool shipped with the JDK
It appears that the memory increase along the build without been released (memory leak).
To analyze the memory, a dump must be fetched. This can easily be done in jvisualvm by clicking on Heap Dump.

Memory Analyzer Tool is a tool that analyze the memory. It can find memory leaks.
When opening the dump, Memory Analyzer Tool find immediately the problem
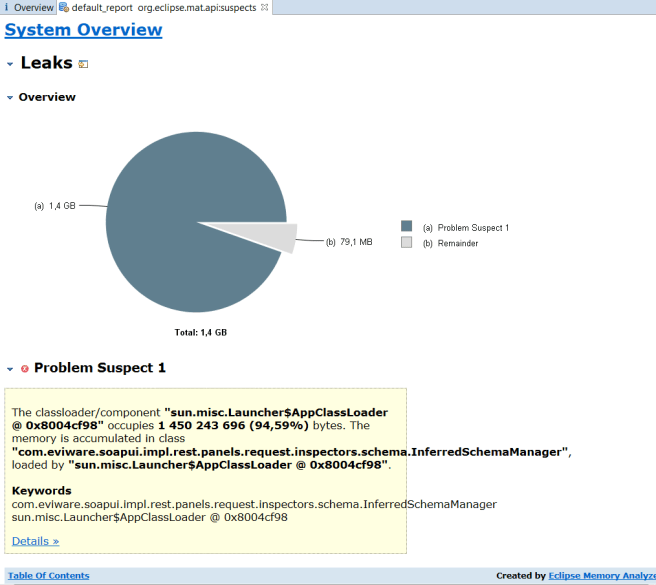
By clicking on details, we can see what happens
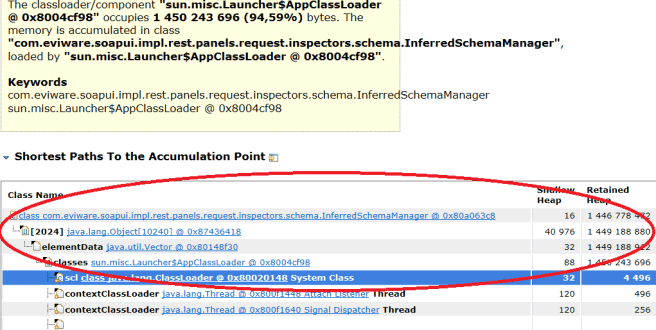
The object InferredSchemaManager from Soap-UI has a Vector containing 2024 objects that occupies more than 1 GB of memory. It is a very good candidate for memory leak.
To see when this Vector is filled, we must have a look at the code of Soap-UI. It can be easily found on gitHub repository https://github.com/SmartBear/soapui
By opening InferredSchemaManager, we can see that there are static collections : perfect candidates for memory leaks because they stay alive as long as the application runs.
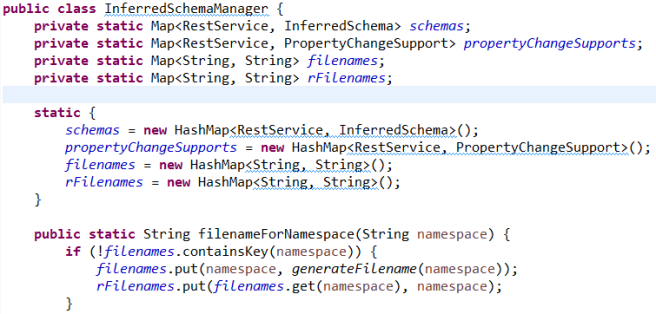
And we see that it is filled each time we load the schema of a rest service
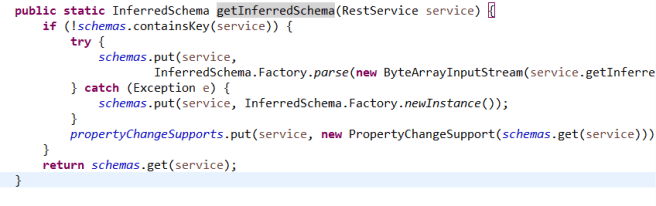
By looking at what the utility of schemas map, we see that it is just a cache for loading schemas so empty it will just have performances issues.
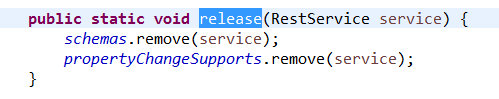
Luckily, there is a release method that empty the table
By watching the call hierarchy we can see that this method is called by WsdlProject.release().
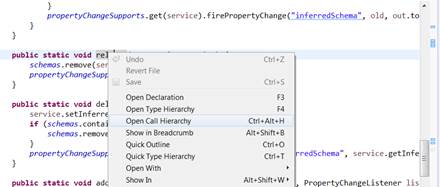
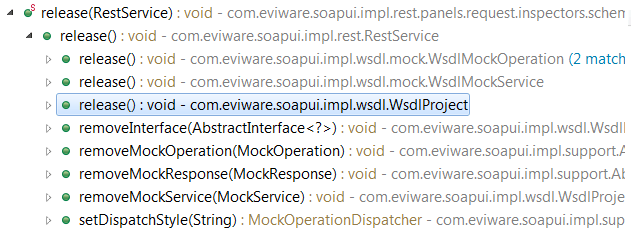
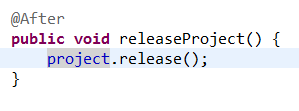
By watching what this method does we see that it releases project resources. So we can call it at the end of our tests.
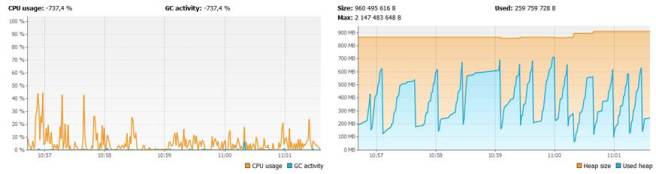
And we see that we don’t have neither memory leaks nor GC Overhead anymore.
It’s weird because this method is never mentioned in the documentation.

